One Hundred Views of Berlin
An interactive map of Berlin that is build on the open data the city provides.
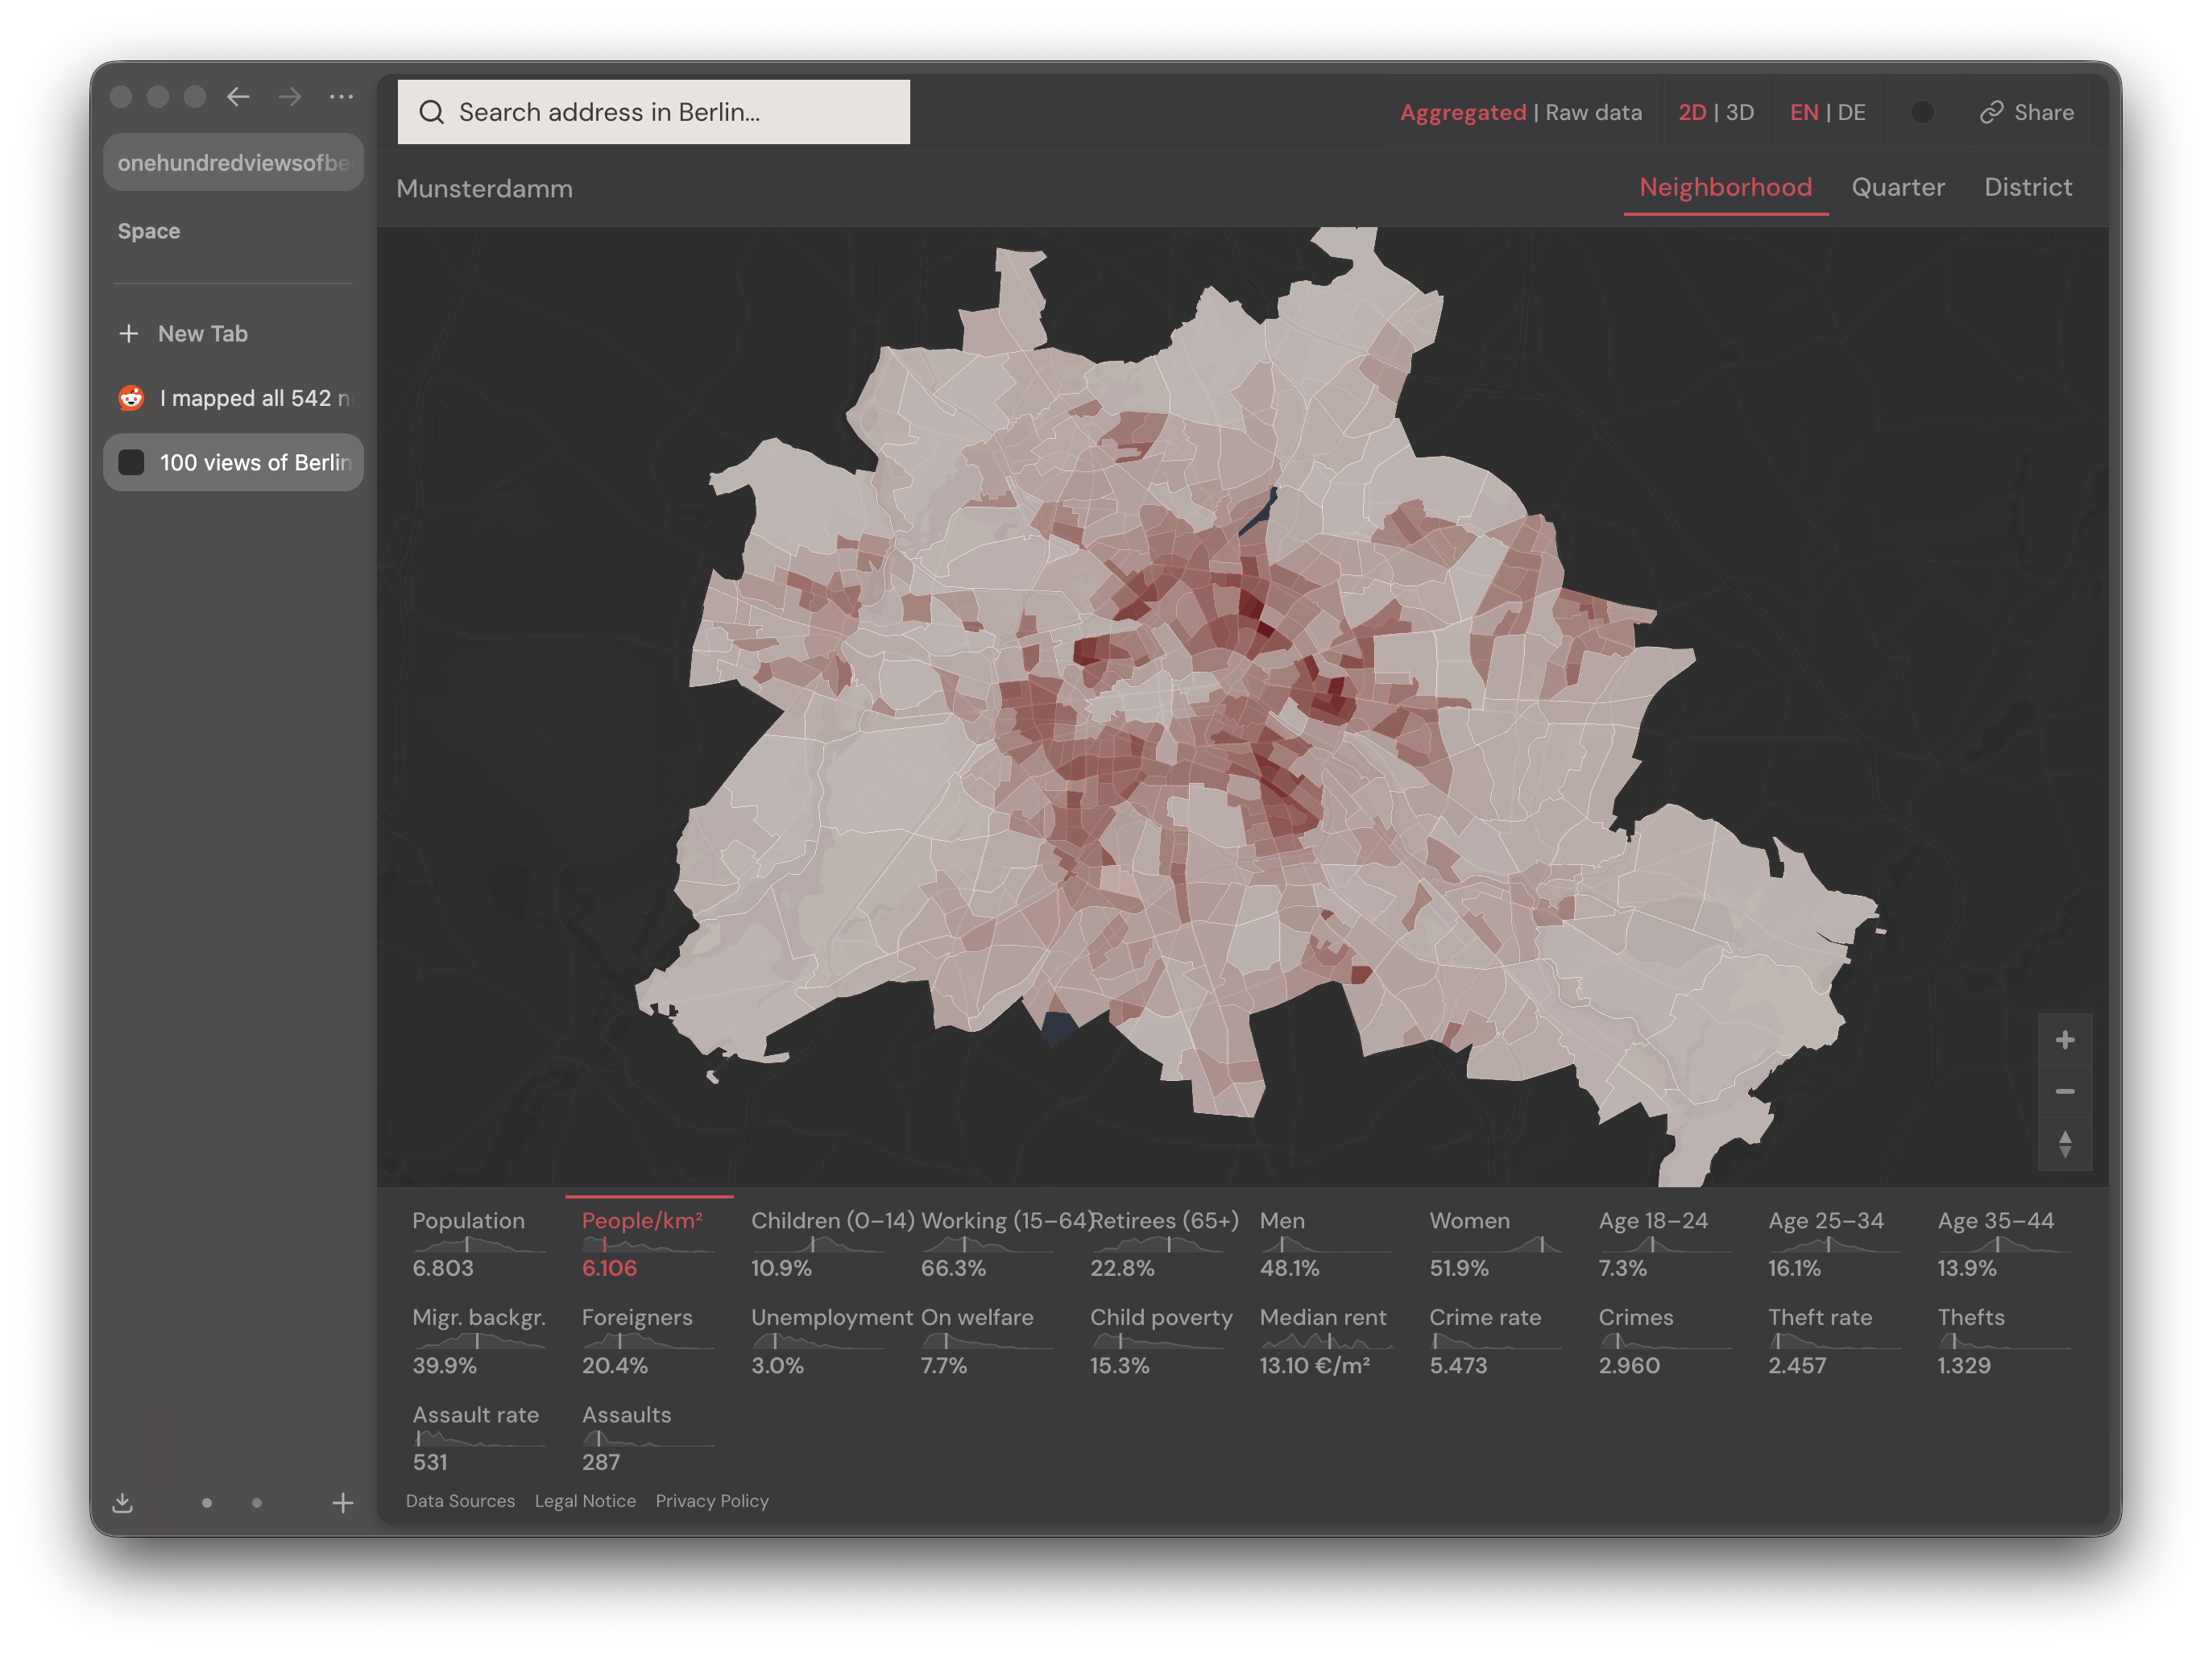
I moved to Berlin recently and wanted to understand the city a bit better. Berlin has a lot of public data, but it is scattered across different portals and spreadsheets. And visiual look like they are from 90s.
So I built an interactive neighbourhood map: pick a layer, click a Kiez, and see how it compares to the rest of the city.
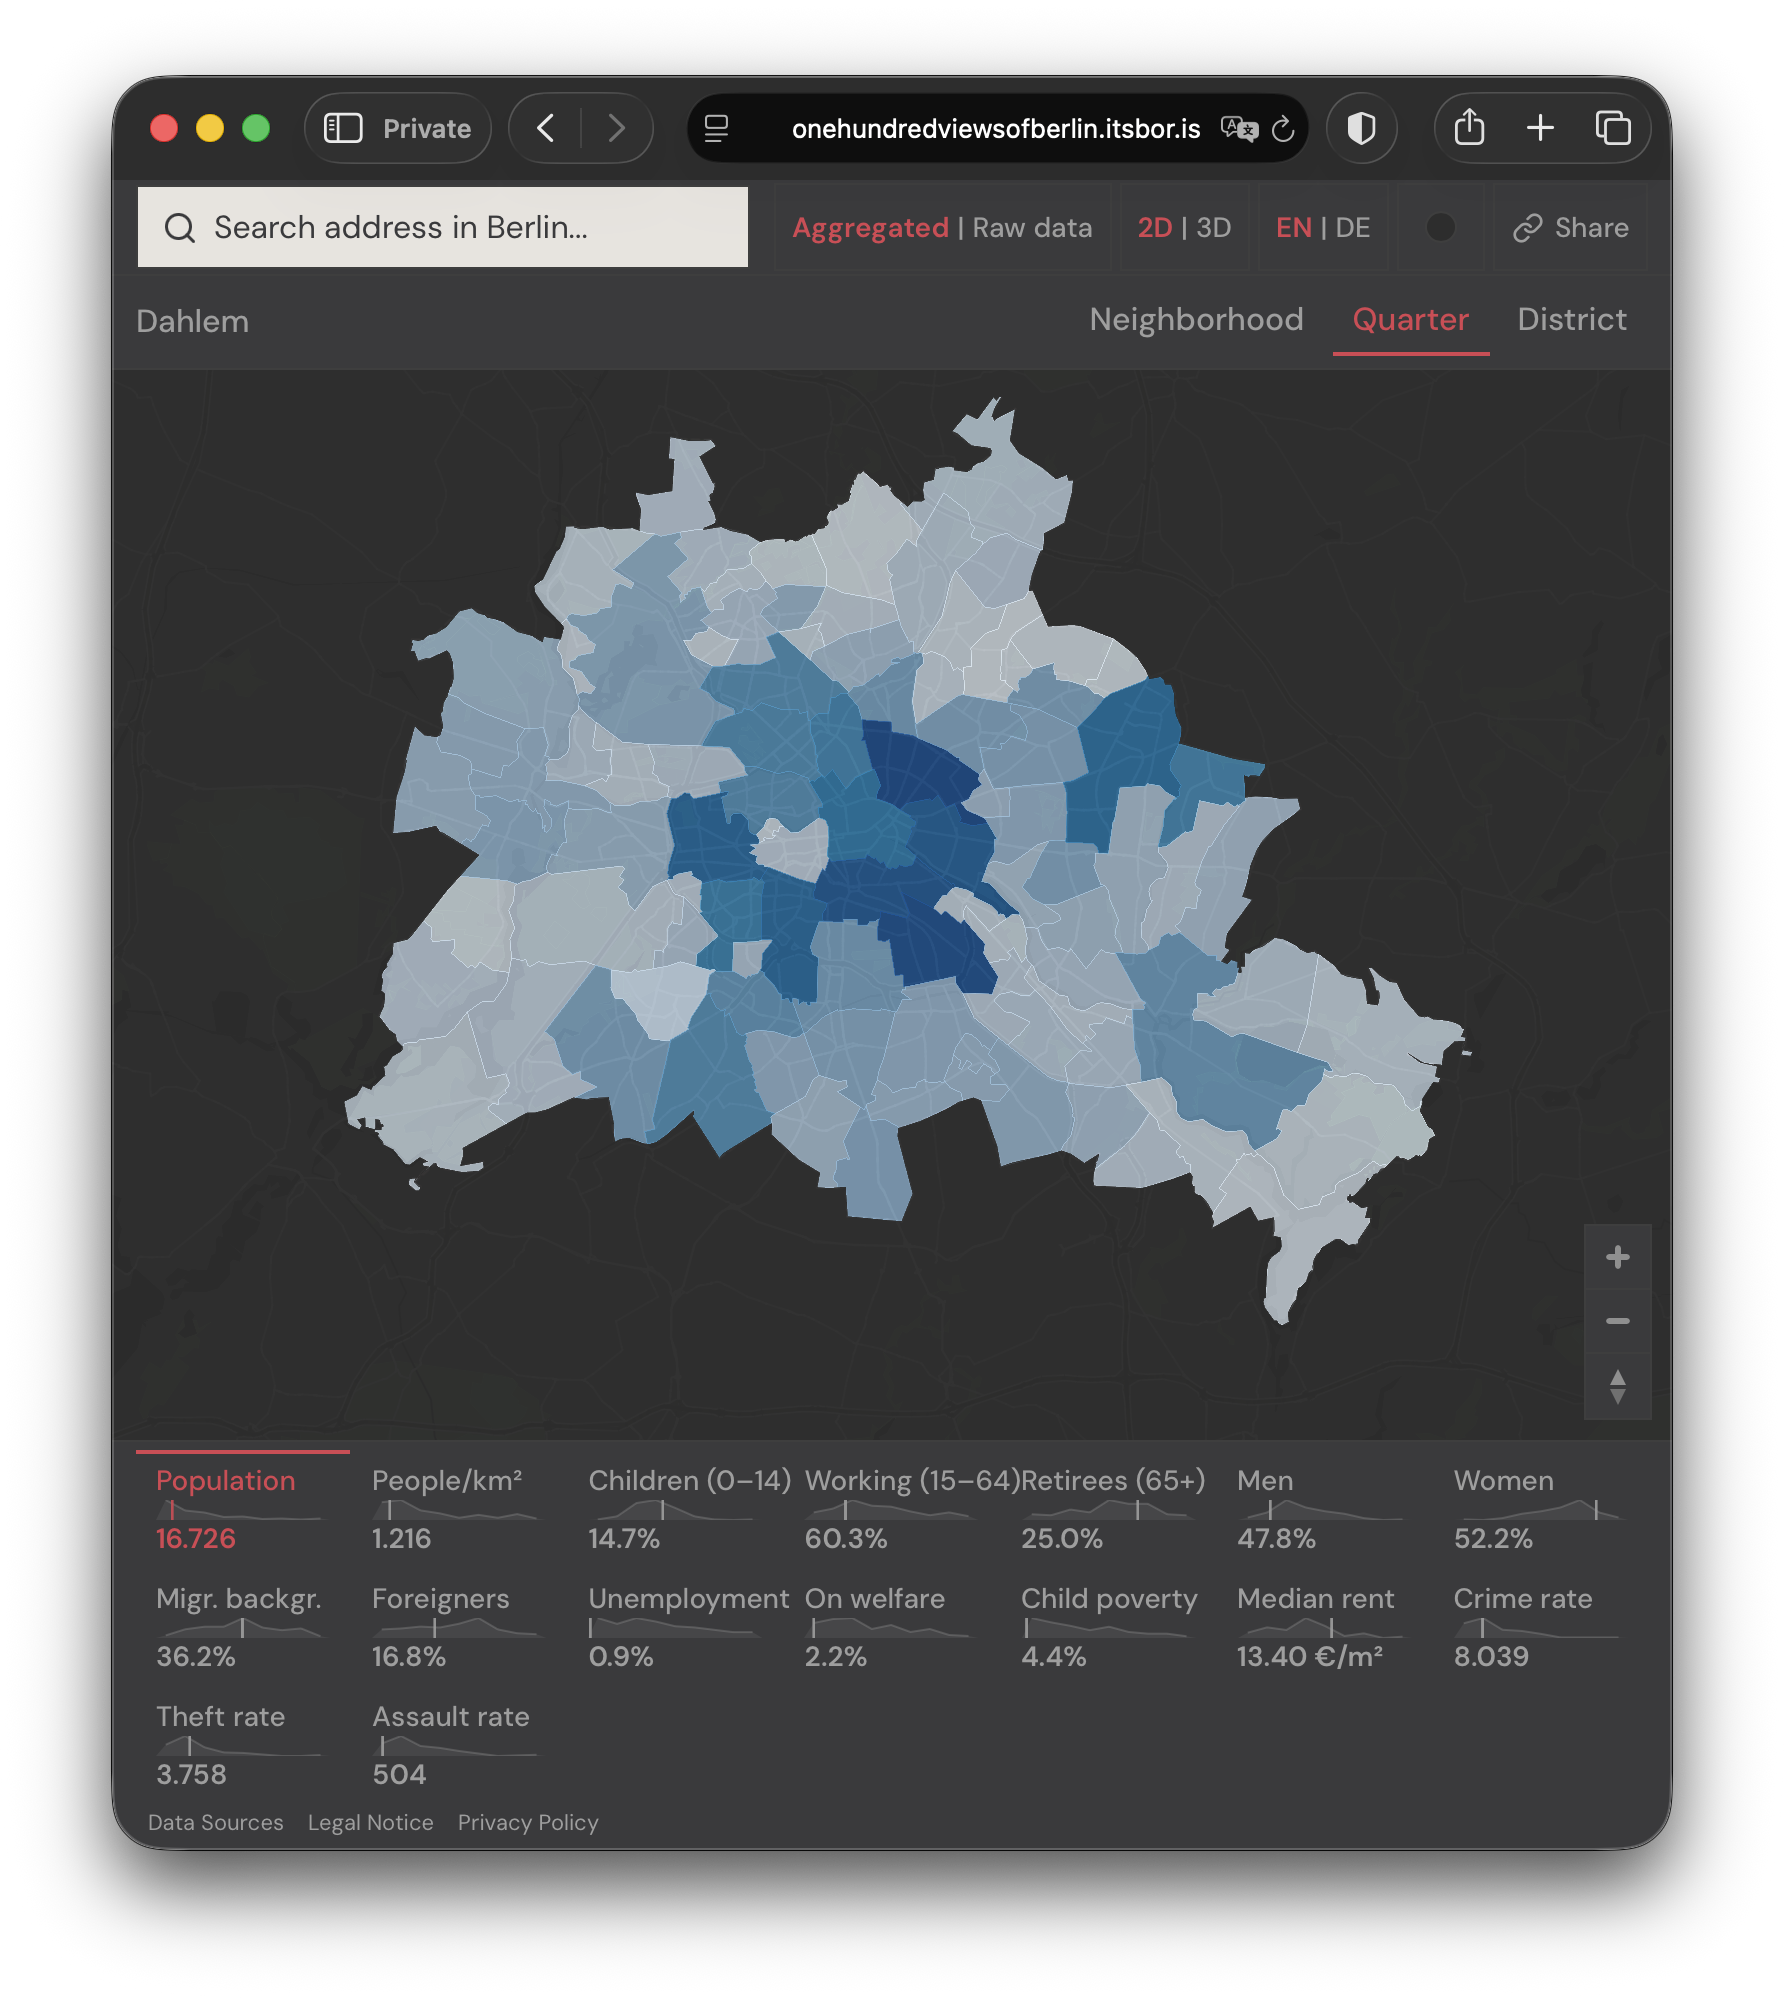
The project covers Berlin at several geographic levels. It includes around 30 date indicators: election results, crime rates, rent, unemployment, child poverty etc.
My goal was to make something visually compelling, useful, and honest about the messiness of city data.
I was also using this project to explore how far coding agents can go in a real product workflow. Claude Code helped a lot. I used a self-built variation of the ralph loop techinique to iterate quickly, then reviewed, corrected, and wrote the important parts manually. Polishing still took a lot of time, but that was the point.
Tech Stack
- Frontend: React + TypeScript
- Map: MapLibre GL JS
- Vector tiles: Tippecanoe + PMTiles
- Geodata processing: QGIS + GDAL
- Data pipeline: Node.js scripts for cleaning, joining, and normalising datasets
- Hosting: static frontend with static vector tiles, no tile server
Workflow (how to do it)
- Collect public datasets from Berlin Open Data and official city sources
- Clean and normalise inconsistent tables, names, IDs, and geographic references
- Join statistical data to Berlin administrative geometries
- Generate vector tiles with Tippecanoe
- Serve geodata as static PMTiles files
- Render the final interactive map with MapLibre